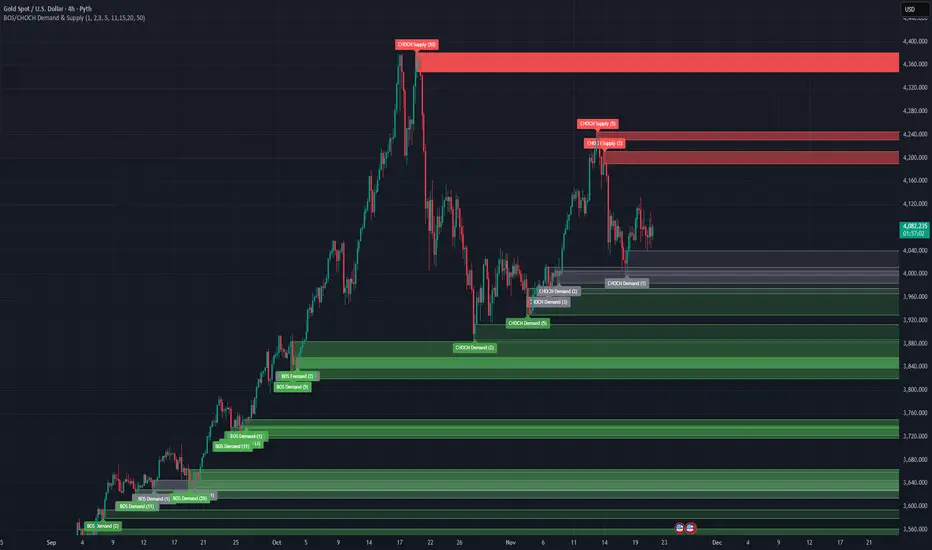
BOS/CHOCH Demand & SupplyThis indicator automatically identifies and plots Supply and Demand zones based on Smart Money Concepts (SMC) methodology. It detects structural breaks in price action and marks the origin zones that initiated these moves.
How It Works (Technical Methodology)
1. Swing Point Detection
The indicator uses Pine Script's ta.pivothigh() and ta.pivotlow() functions to identify swing highs and lows. Users can input multiple lookback periods (e.g., 1, 2, 3, 5, 11, 15, 20) to detect structure across different timeframe perspectives simultaneously.
2. Break of Structure (BOS) Detection
A Bullish BOS is confirmed when:
Current candle closes above the last swing high
Previous candle's high was still below that swing high
The current swing high is higher than the previous swing high (trend continuation)
A Bearish BOS is confirmed when:
Current candle closes below the last swing low
Previous candle's low was still above that swing low
The current swing low is lower than the previous swing low (trend continuation)
3. Change of Character (CHOCH) Detection
A Bullish CHOCH is confirmed when:
Price breaks above the last swing high
But that swing high was lower than the previous swing high (potential reversal signal)
A Bearish CHOCH is confirmed when:
Price breaks below the last swing low
But that swing low was higher than the previous swing low (potential reversal signal)
4. Inducement / Liquidity Grab Filter (Optional)
When enabled, zones are only drawn if the swing point that created them first grabbed liquidity from the previous swing:
For Demand zones: The swing low must have traded below the previous swing low before the bullish break
For Supply zones: The swing high must have traded above the previous swing high before the bearish break
This filter helps identify higher-probability zones where stop-losses were likely triggered before the move.
5. Zone Construction
Demand Zone (Bullish):
Top boundary: max(open, close) of the swing low candle
Bottom boundary: low of the swing low candle
Supply Zone (Bearish):
Top boundary: high of the swing high candle
Bottom boundary: min(open, close) of the swing high candle
This captures the candle body-to-wick range where institutional orders likely reside.
6. Zone Lifecycle Management
Active Zone: Displayed in green (demand) or red (supply)
Mitigated Zone: When price touches the zone but doesn't break it, the zone turns gray (indicating partial fill)
Broken Zone: When price fully breaks through the zone, it is automatically deleted from the chart
How to Use
Demand Zones (Green): Look for long entries when price returns to these zones. The zone represents where buying pressure previously overcame selling.
Supply Zones (Red): Look for short entries when price returns to these zones. The zone represents where selling pressure previously overcame buying.
BOS Zones: Indicate trend continuation - trade in the direction of the break.
CHOCH Zones: Indicate potential reversal - these are early warning signals of trend change.
Enable "Require Inducement" for higher-quality setups where liquidity was grabbed before the structural break.
Multi-Lookback Periods: Using multiple values helps identify zones across different structural levels. Smaller values catch minor structure; larger values catch major structure.
Disclaimer
This indicator is a technical analysis tool and should be used in conjunction with other forms of analysis. Past performance does not guarantee future results. Always use proper risk management.
스크립트에서 "swing high"에 대해 찾기
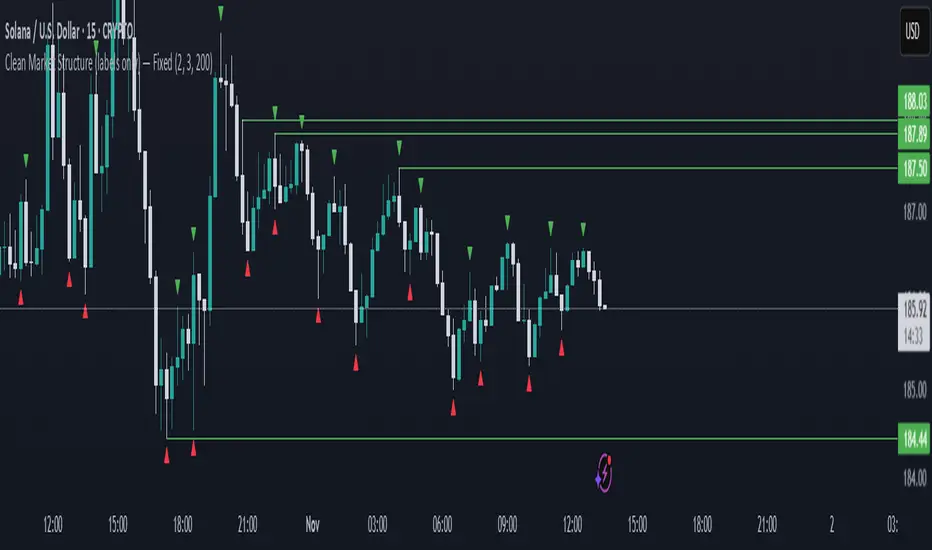
Swing Traces [BigBeluga]🔵 OVERVIEW
The Swing Traces indicator identifies significant swing points in the market and extends them forward as fading traces. These traces represent the memory of recent highs and lows, showing how price interacts with past turning points over time. Traders can use the fading intensity and breakout signals to gauge when a swing has lost influence or when price reacts to it again.
🔵 CONCEPTS
Swing Detection – Detects recent upper and lower swing points using sensitivity-based highs and lows.
Trace Longevity – Each swing projects a “trace” forward in time, gradually fading with age until it expires.
Trace Size – Each trace is drawn with both a main level and a size extension (half of the bar range) to highlight swing influence.
Longevity Counters – Swings remain active for a customizable number of bars before fading out or being crossed by price.
Swing Retest – Labels appear when price retest above/below an active trace extension levels, confirming potential reversal.
🔵 FEATURES
Adjustable sensitivity length for swing detection.
Separate longevity controls for upper and lower swing traces.
Fading gradient coloring for visualizing how long a trace has been active.
Double-trace plotting: one at the swing level and one offset by trace size.
Clear BUY/SELL signals when price crosses a swing trace after it has matured.
🔵 HOW TO USE
Use blue (upper) traces as resistance zones; lime (lower) traces as support zones.
Watch for fading traces: the longer they persist, the weaker their influence becomes.
Retest dots (●) confirm when price retest a trace, signaling a potential reversal.
Shorter sensitivity values detect faster, smaller swings; longer values capture major swing structures.
Combine with trend indicators or volume to filter false breakout signals.
🔵 CONCLUSION
The Swing Traces indicator is a powerful tool for mapping price memory. By projecting recent swing highs and lows forward and fading them over time, it helps traders see where price may react, consolidate, or break through with strength. Its dynamic traces and breakout labels make it especially useful for swing traders, breakout traders, and liquidity hunters.

Liquidity Sweep + BOS Retest System — Prop Firm Edition🟦 Liquidity Sweep + BOS Retest System — Prop Firm Edition
A High-Probability Smart Money Strategy Built for NQ, ES, and Funding Accounts
🚀 Overview
The Liquidity Sweep + BOS Retest System (Prop Firm Edition) is a precision-engineered SMC strategy built specifically for prop firm traders. It mirrors institutional liquidity behavior and combines it with strict account-safe entry rules to help traders pass and maintain funding accounts with consistency.
Unlike typical indicators, this system waits for three confirmations — liquidity sweep, displacement, and a clean retest — before executing any trade. Every component is optimized for low drawdown, high R:R, and prop-firm-approved risk management.
Whether you’re trading Apex, TakeProfitTrader, FFF, or OneUp Trader, this system gives you a powerful mechanical framework that keeps you within rules while identifying the market’s highest-probability reversal zones.
🔥 Key Features
1. Liquidity Sweep Detection (Stop Hunt Logic)
Automatically identifies when price clears a previous swing high/low with a sweep confirmation candle.
✔ Filters noise
✔ Eliminates early entries
✔ Locks onto true liquidity grabs
2. Automatic Break of Structure (BOS) Confirmation
Price must show true displacement by breaking structure opposite the sweep direction.
✔ Confirms momentum shift
✔ Removes fake reversals
✔ Ensures institutional intent
3. Precision Retest Entry Model
The strategy enters only when price retests the BOS level at premium/discount pricing.
✔ Zero chasing
✔ Extremely tight stop loss placement
✔ Prop-firm-friendly controlled risk
4. Built-In Risk & Trade Management
SL set at swept liquidity
TP set by user-defined R:R multiplier
Optional session filter (NY Open by default)
One trade at a time (no pyramiding)
Automatically resets logic after each trade
This prevents overtrading — the #1 cause of evaluation and account breaches.
5. Designed for Prop Firm Futures Trading
This script is optimized for:
Trailing/static drawdown accounts
Micro contract precision
Funding evaluations
Low-risk, high-probability setups
Structured, rule-based execution
It reduces randomness and emotional trading by automating the highest-quality SMC sequence.
🎯 The Trading Model Behind the System
Step 1 — Liquidity Sweep
Price must take out a recent high/low and close back inside structure.
This confirms stop-hunting behavior and marks the beginning of a potential reversal.
Step 2 — BOS (Break of Structure)
Price must break the opposite side swing with a displacement candle. This validates a directional shift.
Step 3 — Retest Entry
The system waits for price to retrace into the BOS level and signal continuation.
This creates optimal R:R entry with minimal drawdown.
📈 Best Markets
NQ (NASDAQ Futures) – Highly recommended
ES, YM, RTY
Gold (XAUUSD)
FX majors
Crypto (with high volatility)
Works best on 1m, 2m, 5m, or 15m depending on your trading style.
🧠 Why Traders Love This System
✔ No signals until all confirmations align
✔ Reduces overtrading and emotional decisions
✔ Follows market structure instead of random indicators
✔ Perfect for maintaining long-term funded accounts
✔ Built around institutional-grade concepts
✔ Makes your trading consistent, calm, and rules-based
⚙️ Recommended Settings
Session: 06:30–08:00 MST (NY Open)
R:R: 1.5R – 3R
Contracts: Start with 1–2 micros
Markets: NQ for best structure & volume
📦 What’s Included
Complete strategy logic
All plots, labels, sweep markers & BOS alerts
BOS retest entry automation
Session filtering
Stop loss & take profit system
Full SMC logic pipeline
🏁 Summary
The Liquidity Sweep + BOS Retest System is a complete, prop-firm-ready, structure-based strategy that automates one of the cleanest and most reliable SMC entry models. It is designed to keep you safe, consistent, and rule-compliant while capturing premium institutional setups.
If you want to trade with confidence, discipline, and prop-firm precision — this system is for you.
Good Luck -BG

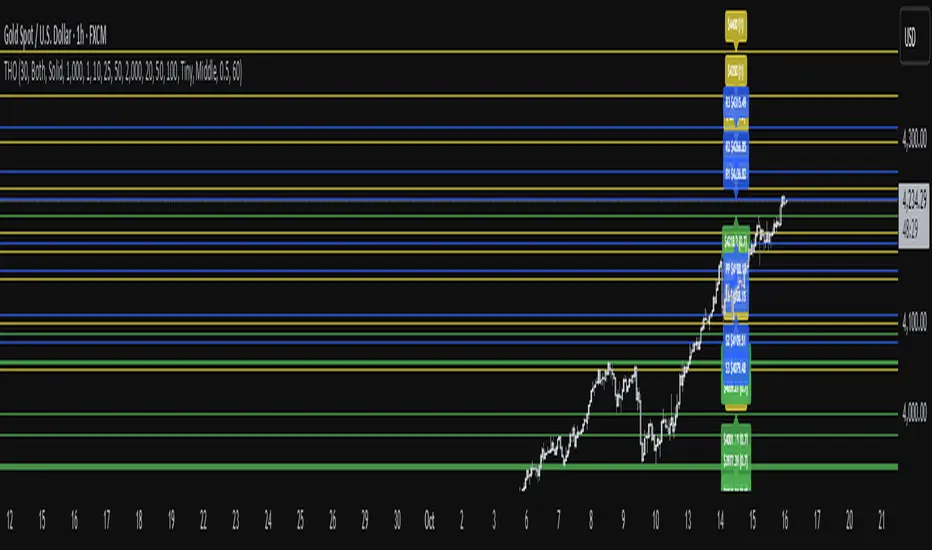
HTF Candles Pro by MurshidFx# HTF Candles Pro by MurshidFx
## Professional Trading Indicator for Multi-Timeframe Market Structure Analysis
**HTF Candles Pro** is an advanced, open-source trading indicator that synthesizes Higher Timeframe (HTF) candle visualization with CISD (Change in State of Delivery) detection, providing comprehensive market structure analysis across multiple timeframes. Designed for traders at all experience levels—from scalpers to swing traders—this tool enables precise alignment of trades with higher timeframe momentum while identifying critical market structure transitions.
---
## Core Functionality
This indicator integrates three essential analytical frameworks:
- **HTF Candle Visualization** – Inspired by the innovative work of Fadi x MMT's MTF Candles indicator
- **CISD Detection System** – Algorithmic identification of significant market structure reversals
- **Intelligent Session Level Management** – Automated consolidation of overlapping session markers for enhanced chart clarity
The result is a sophisticated yet streamlined analytical tool that delivers actionable market insights with minimal visual complexity.
---
## Feature Set
### Higher Timeframe Candle Analysis
Monitor higher timeframe price action seamlessly without chart switching. The indicator employs automatic HTF selection based on current timeframe, with manual override capability.
**Components:**
- **Primary HTF Display**: Automatically positioned adjacent to current price action
- **Secondary HTF Display**: Optional dual-timeframe analysis capability
- **Adaptive Time Labeling**: Context-aware formatting (intraday times, day names, week numbers)
- **Real-Time Countdown**: Optional timer displaying remaining time until HTF candle close
- **Customizable Color Schemes**: Full color customization for bullish and bearish candles
### CISD Detection (Change in State of Delivery)
The CISD system identifies critical inflection points where market structure undergoes directional change, signaling potential trend reversals or continuations.
**Mechanism:**
- **Market Structure Monitoring**: Continuous tracking of swing highs and lows
- **Liquidity Sweep Detection**: Identification of stop-hunt patterns preceding reversals
- **Reversal Confirmation**: Validation-based CISD level plotting upon structure break confirmation
- **Clear Visual Signals**: Bullish CISD (blue) and bearish CISD (red) demarcation
- **Optimized Display**: Default 5-bar line length (adjustable) minimizes chart clutter
**Technical Definition:**
CISD occurs when price breaches structure in one direction—typically sweeping liquidity and triggering stops—then reverses to break structure in the opposite direction, indicating a fundamental shift in market delivery bias.
### Intelligent Session Level Management
Eliminates visual clutter caused by overlapping session opens at identical price levels through automated consolidation.
**Functionality:**
- **Automatic Consolidation**: Merges multiple concurrent session opens into single reference lines
- **Combined Labeling**: Creates unified labels (e.g., "Week-Day Open," "4H-Day-Week Open")
- **Enhanced Clarity**: Maintains professional chart aesthetics while preserving all relevant information
**Supported Session Intervals:**
- 30-Minute Opens
- 4-Hour Opens
- Daily Opens
- Weekly Opens
- Monthly Opens
### Advanced Market Structure Tools
**Liquidity Sweep Identification:**
Highlights price wicks extending beyond previous HTF extremes that close within range—characteristic liquidity grab patterns.
**HTF Midpoint Reference:**
Displays the 50% retracement level of the most recent completed HTF candle, serving as a key reference for entries and profit targets.
**HTF Opening Price:**
Tracks current HTF candle open price, frequently functioning as dynamic support or resistance.
**Interval Demarcation:**
Visual separators defining HTF period boundaries for enhanced temporal clarity.
### Information Dashboard
Compact, customizable dashboard displaying:
- Current symbol and active timeframe
- HTF candle countdown timer
- Active trading session (Asia/London/New York)
- Current date and time
Flexible positioning: configurable for any chart corner.
---
## Default Configuration
Optimized settings for immediate professional-grade chart presentation:
- **Secondary HTF**: Disabled (enable for multi-timeframe comparative analysis)
- **CISD Bullish Color**: Blue (#0080ff) – optimal visibility with reduced eye strain
- **CISD Line Width**: 1 pixel – subtle yet discernible
- **CISD Line Length**: 5 bars – balanced visibility without excessive clutter
- **Session Opens**: Smart consolidation enabled – eliminates overlapping labels
---
## Application Strategies
### Trend Following
1. Monitor CISD confirmations aligned with HTF trend direction
2. Utilize HTF candle color for directional bias confirmation
3. Execute entries on pullbacks to HTF midpoint or open price levels
### Reversal Trading
1. Identify counter-trend CISD formations
2. Await HTF candle close confirming new directional bias
3. Use session opens as secondary confirmation levels
### Scalping
1. Trade exclusively in HTF candle direction
2. Employ lower timeframe CISD signals for precise entry timing
3. Target HTF midpoint or subsequent session open levels
### Structure-Based Trading
1. Mark liquidity sweep levels as potential reversal zones
2. Monitor CISD formations at key session opens
3. Confirm trend changes via HTF candle closes
---
## Customization Parameters
Comprehensive customization options:
- **Color Schemes**: Independent control of bull/bear candles, borders, CISD signals, session levels
- **Dimensional Settings**: Candle width, line thickness, label sizing
- **Display Quantities**: HTF candle count (1-10 range)
- **Positioning**: Candle offset, dashboard placement, label positioning
- **Line Styles**: Solid, dashed, or dotted rendering
- **Timeframe Selection**: Manual secondary HTF specification
---
## Attribution
**HTF Candle Visualization:**
The HTF candle rendering methodology draws inspiration from Fadi x MMT's "MTF Candles" indicator. Their elegant implementation of multi-timeframe candle visualization provided valuable reference for this development. Recognition and appreciation to their contribution to the TradingView community.
**CISD Detection:**
Proprietary CISD detection algorithm engineered to identify market structure transitions with high signal clarity and reduced false positive rate.
**Session Level Consolidation:**
Custom-developed intelligent grouping system addressing the common challenge of overlapping session labels at coincident price levels.
---
## Open Source License
This indicator is released as open source for the TradingView community. Permitted uses include:
- Implementation in live trading
- Educational study for Pine Script learning
- Personal modification and customization
- Distribution among trading communities
Community contributions, improvements, and derivative works are welcomed and encouraged.
---
## Implementation Guide
1. **Installation**: Click "Add to Chart"
2. **Configuration Access**: Open indicator settings panel
3. **Initial Use**: Default settings provide optimal starting configuration
4. **Optional Features**: Enable secondary HTF for multi-timeframe analysis
5. **Theme Integration**: Adjust color schemes to match chart aesthetics
---
## Best Practices
**Timeframe Optimization:**
- 1-5 minute charts: Optimal with 15m or 1H HTF
- 15-30 minute charts: Effective with 4H HTF
- 1-4 hour charts: Suitable for Daily HTF
- Daily charts: Best utilized with Weekly/Monthly HTF
**CISD Trading Guidelines:**
- Require CISD confirmation before position entry
- Prioritize CISD signals at significant levels (session opens, HTF midpoints)
- Confirm CISD direction aligns with HTF candle bias
- Apply contextual filtering—not all CISD signals warrant trades
**Session Open Strategy:**
- Weekly opens typically provide robust support/resistance
- Daily opens offer reliable intraday reference points
- 4-Hour opens effective for short-term scalping
- Consolidated labels (e.g., "Week-Day Open") indicate confluence zones with elevated significance
---
## Technical Specifications
**Performance Optimization:**
- Intelligent object management prevents TradingView rendering limits
- Efficient array processing for session consolidation
- Proper memory management through systematic object deletion
- Consistent performance across all timeframe ranges
**Compatibility:**
- Universal timeframe support
- Optimized for all market types (forex, stocks, crypto, futures)
- Minimal computational overhead
---
## Support & Development
**Feedback Channels:**
- Comment section for user feedback and suggestions
- Bug reports and feature requests welcomed
- Community-driven enhancement consideration
**Documentation:**
- Well-commented source code for learning purposes
- Clear section organization for easy navigation
- Comprehensive type definitions for structural clarity
- Educational value for market structure concept understanding
---
## Version Information
**Version:** 1.0 (Initial Release)
**License:** Open Source
**Category:** Multi-Timeframe Analysis | Market Structure
**Compatibility:** All Timeframes
**Language:** Pine Script v5
---
**For optimal results:**
- Provide feedback through comments
- Share with trading communities
- Submit enhancement suggestions
- Report technical issues for resolution
**Professional Support:**
Available through comment section for technical inquiries, implementation questions, and feature requests.
---
*Developed for the TradingView trading community | Professional-grade market structure analysis | Open source contribution*

UltimateFlow by Kate V0.2Ultimate Flow Script: Tracks market structure breaks, buy/sell entries (CE/SE), and trends with a Zero Lag SMA. Highlights Bullish & Bearish Order Blocks (OB, BB, MM) with dynamic boxes and tiny labels. Zigzag swings visualize market structure for smart entries. Play with the various settings to suit your trading style. Alerts available for MSB changes and price in OB zones.
Disclaimer: This script is for educational and informational purposes only. It should be used in line with your own trading strategy, risk management, and discretion. Past performance is not indicative of future results.
This script is designed for price action, market structure, and order block analysis on TradingView. It includes:
Buy & Sell Signals (CE/SE) – Highlights potential entries based on market structure breaks and trend changes. Mini triangles or markers indicate possible reversals.
Zero Lag SMA (ZSMA) – Smooths price action for trend confirmation without delay. Helps identify trend direction and support/resistance areas.
Order Blocks (OBs) – Highlights key Bullish (Bu-OB) and Bearish (Be-OB) order blocks on the chart. Boxes dynamically extend as price evolves and include tiny labels (Bu-OB, Be-BB, MM, etc.) for clarity.
Zigzag Market Structure – Draws swing highs and lows to visualize market structure breaks (MSB).
How it works:
OB boxes extend automatically and change when price breaks them.
CE/SE markers help identify high-probability trade entries.
ZSMA confirms trend direction.
Alerts can be set for MSB changes or when price enters an OB zone.

Gann Square of 144 (Master Price & Time)🔹 What this tool does
Draws a 144-unit square in price & time (0 → 144)
Plots all key horizontal & vertical levels:
0, 18, 36, 48, 54, 72, 90, 96, 108, 126, 144
Highlights the main 1/2 level (72) as thick midline
Marks 1/3 and 2/3 (48 & 96) as special harmonic levels
Draws internal diagonals (0–144, 144–0 and sub-squares)
Plots an 8-ray Gann fan from the 0-point (0 → 36 / 72 / 108 / 144 etc.)
Keeps price–time ratio consistent inside the box:
the 1×1 angle has a fixed slope = price_per_bar
The idea: once the square is calibrated to a major swing, you can study how price respects these angles and harmonic zones over time.
🔧 Inputs & how to set it up correctly
Choose your timeframe
Works best on Daily and Weekly charts.
Use one timeframe consistently when calibrating the square.
Start offset (bars back)
Start offset (bars back) shifts the whole square left/right.
Increase the value to move the square further into the past, decrease it to move it closer to the current bars.
Box width (bars)
Box width (bars) = how many bars the square spans horizontally.
Bigger value = projects the structure further into the future.
Example: 288 bars ≈ 2×144 units in time, 720 bars for longer-term projection, etc.
Bottom price
Bottom price is your 0-level in price.
Usually set this to a major swing low (cycle low, bear market low, important pivot).
The bottom-left corner of the square conceptually sits at:
(start_offset_bar, bottom_price)
Price per bar (slope 1×1) (if your version has this input)
This defines the slope of the 1×1 angle (main Gann angle).
Recommended way to set it:
Pick a major impulsive move from Swing Low → Swing High.
Measure:
Price range = High − Low
Number of bars between them.
Compute:
price_per_bar = price_range / number_of_bars
Use that as your 1×1 value in the input.
Now the main diagonal from 0 to 144 represents the true Gann 1×1 for that swing.
Important: The 1×1 angle is mathematically correct (price-per-bar), even if it does not always look like a perfect 45° line visually in TradingView due to chart scaling.
📖 How to read the Square of 144
Horizontal levels
0 = anchor price (bottom)
18, 36, 48, 54, 72, 90, 96, 108, 126, 144 = key price harmonics
72 (1/2) often acts as major support/resistance
48 & 96 (1/3 and 2/3) are strong “vibration” levels
Vertical levels
Same units but in time (bars).
When important pivots in price occur near these verticals, you get time–price confluence.
Midlines (1/2)
The thick horizontal and vertical lines at 72 mark the center of the square.
Crossings around these often signal important cycle turns.
1/3 & 2/3 zones (48–54 and 90–96)
These narrow bands are powerful reversal / decision zones.
Price often reacts strongly there or accelerates if they break.
Gann fan from 0-point
These rays represent major trends:
1×1 equivalent (main diagonal)
Faster & slower angles (e.g. 2×1, 1×2, etc depending on configuration)
If price breaks one fan angle cleanly, it often “falls” or “climbs” toward the next one.
🎯 Practical use cases
Project future support/resistance zones based on a major low.
See where price is in the square: early in the cycle (0–36), mid (around 72), or late (108–144).
Watch how price respects:
midlines (72),
1/3 and 2/3 bands (48–54, 90–96),
and the fan angles from 0.
Combine with your own price action / Fibonacci / trend tools – this is not a signal generator, but a time–price map.
⚠️ Notes & limitations
This tool is for educational & analytical purposes only.
It does not generate buy/sell signals.
Visual 45° angles in TradingView can change when you zoom or rescale the chart.
→ The script keeps the internal price-per-bar logic stable, even if the drawing looks steeper/flatter when zooming.
Always confirm zones with price action, volume, and higher timeframe context.

TraderDemircan Fibonacci + XABCD Formation v1.0This indicator automatically identifies the most recent significant swing low (Point X) and the subsequent swing high (Point A) to plot a comprehensive set of Fibonacci extension levels.
Beyond a standard Fibonacci tool, this script also projects a potential harmonic XABCD pattern. It identifies a retracement level (Point B) and projects a "C" target based on the XA=BC price projection. This provides traders with a complete visual framework of key support/resistance levels and potential price targets based on the last significant impulse move.
How It Works
Swing Detection (X & A Points): The script scans the previous Lookback Bars (user-defined) to find the lowest low, which it labels as Point X. It then finds the highest high that occurred after Point X, labeling it as Point A.
Fibonacci Levels: The price range between X and A (the "XA leg") is used as the basis (0.0 to 1.0) to draw 18 different Fibonacci levels, including key extensions (1.272, 1.618, 2.618, etc.) and retracements.
XABCD Projection (B & C Points):
Point B: The script dynamically identifies Point B at either the 0.382 or 0.5 retracement level of the XA leg, depending on the current price action. This shows the level that is currently acting as support.
Point C (Target): A target (Point C) is projected by adding the price range of the XA leg to the B point. This creates a classic XA=BC (or AB=CD, where the first leg is XA) price projection, offering a potential target for the next upward move.
Key Features
Automatic Swing Detection: Automatically finds and plots the X and A points, adapting to the latest price action.
Comprehensive Fibonacci Suite: Includes 18 toggleable Fibonacci levels (from 0.0 to 4.618) to cover all common retracement and extension targets.
XABCD Pattern & Target: Visually plots the X-A, A-B, and the projected B-C legs, clearly highlighting the C target.
Dynamic "B" Point: The B point label (0.382 or 0.5) updates to reflect which retracement level is currently in play.
On-Screen Info Table: A clean table in the top-right corner displays the exact price values for X, A, B, and the C Target for quick reference.
Full Customization: Users can control the visibility, color, width, and style of every Fibonacci level and pattern line.
Label Options: Toggle price labels (on the right) and percentage/level labels (on the left) for a clean or detailed chart.

Zone Tap Counter: Support & Resistance StrengthWhat is this indicator?
This script is designed to help traders objectively monitor the strength and significance of price zones by counting and visualizing how many times price “taps” confirmed support and resistance levels. The indicator leverages swing high/low detection to automatically plot relevant zones and uses price tap frequency as an objective strength metric.
How does it work?
Zone Identification:
The script uses the Pine Script functions ta.pivothigh and ta.pivotlow to detect confirmed swing highs and lows on your chart. Each swing high establishes a resistance zone, and each swing low establishes a support zone.
Only confirmed pivots are used, ensuring all signals are strictly non-repainting.
Tap Counting Logic:
For every candle, the indicator checks whether price touches (comes within a small, user-set tolerance) of any currently tracked support or resistance zone. To avoid counting repeated taps in the same move, the script ensures only unique bar taps are registered.
Each time price taps a zone, a counter for that zone is incremented.
Both the tolerance for taps (percentage-based), and the depth/history of zones tracked are fully adjustable in settings.
Visual Feedback:
Zones with more taps are drawn darker (lower transparency), making it easy to spot the strongest/hardest-tested levels on the chart.
A label on each zone displays the current tap count (e.g., "3x"), giving direct feedback about which support/resistance are most significant in the current view.
Only recent zones (user-configurable) are shown to keep charts clear and useful.
How to use it:
Add the indicator to your TradingView chart.
Set the swing length and tap tolerance in settings to match your market or timeframe (short swing length for scalping, longer swings for bigger structure).
Watch for zones with high tap counts and darker lines: These zones represent areas where price has repeatedly reacted, suggesting they may be important for your trading decisions.
You can adjust the minimum number of taps needed for a zone to be highlighted and the number of zones to display for your preferred visual clarity.
Combine this tool with other analysis for confirmation—tap counts should not be seen as trading signals, but as supporting information.
Originality & Calculation Details:
This script does NOT simply merge or overlay existing indicators. The calculation method is original: it uses swing-based support/resistance and applies unique tap-count logic, designed for objective zone strength visualization.
No repainting logic is present.
All code and visualization methods are documented and transparent.
Disclaimer:
This indicator is for educational and analytical purposes only. It does not predict future price movement, guarantee profits, or recommend specific trades. Always use your own analysis and risk management. See TradingView’s House Rules for more details.

SMT + CVD (NQ vs ES) w/ AlertsSMT + CVD (NQ vs ES) w/ Alerts
This tool combines Smart Money Technique (SMT) and Cumulative Volume Delta (CVD) to highlight high-probability inflection points on NQ (primary) versus ES (secondary).
How it works
SMT condition: the primary breaks its most recent swing (High for bearish / Low for bullish) while the secondary does not break the corresponding swing within a small retest window.
CVD confirmation: at the same time, the primary’s CVD shows divergence (higher price but lower/equal CVD for shorts, lower price but higher/equal CVD for longs).
When both align, the script plots a marker/label and draws a line from the primary swing to the signal bar. Alerts are fired.
Signals & Alerts
Labels: “SMT+CVD DOWN/UP” on the signal bar.
Lines: connects the primary swing → signal bar so you can see the structure that produced the signal.
Alert names: “SMT+CVD Bearish” and “SMT+CVD Bullish.”
Inputs
Primary / Secondary symbols: defaults NQ & ES (you can change them).
Resolution: use chart timeframe or specify one.
Swing Left/Right Bars: pivot detection depth (higher = larger swings).
Break Window Bars: how many bars the secondary has to not break for SMT to be valid.
CVD Up/Down By: Close vs Previous Close (default) or Close vs Open.
Anchor CVD Daily: resets CVD at session/day start.
CVD Smoothing (EMA): smooths the CVD line (optional show).
FAST Pivots (no future bars): left-only swing detection so signals appear sooner and behave well in Replay/live.
Require Secondary Pivot: if ON, SMT checks wait for a confirmed secondary swing; if OFF, signals can appear while the secondary swing is still forming (useful for Replay/testing).
Show CVD line: optional, may compress price scale.
Non-repaint notes
With FAST Pivots ON, swings are detected with no future bars (minimal latency = leftBars).
With FAST Pivots OFF, standard pivots require rightBars future bars to confirm the swing (classic, but naturally delayed).
Tips
For intraday futures, keep leftBars/rightBars small (e.g., 3/3) and Break Window 1–3.
In Replay, enable FAST Pivots and consider disabling Require Secondary Pivot if you want signals to appear as soon as the primary breaks.
Combine with session filters, execution rules, or liquidity zones for context.

MTF Support & Resistance (Optimized)🧠 Smart Multi-Timeframe Support & Resistance (4H / 1H)
This advanced indicator automatically detects, clusters, and visualizes high-probability support and resistance levels across multiple timeframes — giving traders a clean and intelligent market map that adapts to price action in real time.
🔍 How It Works
The script scans historical 4-hour and 1-hour charts to identify swing highs and lows using pivot logic.
It then applies ATR-based clustering to merge nearby levels, filters weak or irrelevant zones, and highlights the most significant price reaction areas based on the number of touches and proximity to the current price.
Each level’s thickness and transparency are dynamically adjusted by strength:
Thicker lines = more confirmations (stronger level)
Fainter lines = weaker, less-tested level
⚙️ Main Features
✅ Multi-Timeframe Analysis (4H + 1H)
✅ Automatic pivot detection and level clustering
✅ Smart filtering based on ATR, proximity, and touch count
✅ Dynamic line width and opacity that scale with level strength
✅ Minimal clutter — only the most relevant nearby levels are displayed
✅ Color-coded visualization for quick interpretation
🔴 Red = 4H Resistance
🟢 Lime = 4H Support
🟠 Orange = 1H Resistance
🟦 Aqua = 1H Support
🎯 Ideal For
Scalpers, swing traders, and intraday analysts who want:
A clear visual map of major reaction zones
Automatic detection of high-confluence levels
A smart, adaptive system that works across assets and timeframes
📈 Usage Tips
Combine with volume, order-flow, or market-structure tools for confluence.
Use higher-strength levels (thicker lines) as bias zones for entries and exits.
Enable or disable 4H/1H visibility to match your trading style.
Built with precision and performance in mind — this Smart S&R system transforms raw swing data into a readable, multi-layered price map for confident trading decisions.

3D Institutional Battlefield [SurgeGuru]Professional Presentation: 3D Institutional Flow Terrain Indicator
Overview
The 3D Institutional Flow Terrain is an advanced trading visualization tool that transforms complex market structure into an intuitive 3D landscape. This indicator synthesizes multiple institutional data points—volume profiles, order blocks, liquidity zones, and voids—into a single comprehensive view, helping you identify high-probability trading opportunities.
Key Features
🎥 Camera & Projection Controls
Yaw & Pitch: Adjust viewing angles (0-90°) for optimal perspective
Scale Controls: Fine-tune X (width), Y (depth), and Z (height) dimensions
Pro Tip: Increase Z-scale to amplify terrain features for better visibility
🌐 Grid & Surface Configuration
Resolution: Adjust X (16-64) and Y (12-48) grid density
Visual Elements: Toggle surface fill, wireframe, and node markers
Optimization: Higher resolution provides more detail but requires more processing power
📊 Data Integration
Lookback Period: 50-500 bars of historical analysis
Multi-Source Data: Combine volume profile, order blocks, liquidity zones, and voids
Weighted Analysis: Each data source contributes proportionally to the terrain height
How to Use the Frontend
💛 Price Line Tracking (Your Primary Focus)
The yellow price line is your most important guide:
Monitor Price Movement: Track how the yellow line interacts with the 3D terrain
Identify Key Levels: Watch for these critical interactions:
Order Blocks (Green/Red Zones):
When yellow price line enters green zones = Bullish order block
When yellow price line enters red zones = Bearish order block
These represent institutional accumulation/distribution areas
Liquidity Voids (Yellow Zones):
When yellow price line enters yellow void areas = Potential acceleration zones
Voids indicate price gaps where minimal trading occurred
Price often moves rapidly through voids toward next liquidity pool
Terrain Reading:
High Terrain Peaks: High volume/interest areas (support/resistance)
Low Terrain Valleys: Low volume areas (potential breakout zones)
Color Coding:
Green terrain = Bullish volume dominance
Red terrain = Bearish volume dominance
Purple = Neutral/transition areas
📈 Volume Profile Integration
POC (Point of Control): Automatically marks highest volume level
Volume Bins: Adjust granularity (10-50 bins)
Height Weight: Control how much volume affects terrain elevation
🏛️ Order Block Detection
Detection Length: 5-50 bar lookback for block identification
Strength Weighting: Recent blocks have greater impact on terrain
Candle Body Option: Use full candles or body-only for block definition
💧 Liquidity Zone Tracking
Multiple Levels: Track 3-10 key liquidity zones
Buy/Sell Side: Different colors for bid/ask liquidity
Strength Decay: Older zones have diminishing terrain impact
🌊 Liquidity Void Identification
Threshold Multiplier: Adjust sensitivity (0.5-2.0)
Height Amplification: Voids create significant terrain depressions
Acceleration Zones: Price typically moves quickly through void areas
Practical Trading Application
Bullish Scenario:
Yellow price line approaches green order block terrain
Price finds support in elevated bullish volume areas
Terrain shows consistent elevation through key levels
Bearish Scenario:
Yellow price line struggles at red order block resistance
Price falls through liquidity voids toward lower terrain
Bearish volume peaks dominate the landscape
Breakout Setup:
Yellow price line consolidates in flat terrain
Minimal resistance (low terrain) in projected direction
Clear path toward distant liquidity zones
Pro Tips
Start Simple: Begin with default settings, then gradually customize
Focus on Yellow Line: Your primary indicator of current price position
Combine Timeframes: Use the same terrain across multiple timeframes for confluence
Volume Confirmation: Ensure terrain peaks align with actual volume spikes
Void Anticipation: When price enters voids, prepare for potential rapid movement
Order Blocks & Voids Architecture
Order Blocks Calculation
Trigger: Price breaks fractal swing points
Bullish OB: When close > swing high → find lowest low in lookback period
Bearish OB: When close < swing low → find highest high in lookback period
Strength: Based on price distance from block extremes
Storage: Global array maintains last 50 blocks with FIFO management
Liquidity Voids Detection
Trigger: Price gaps exceeding ATR threshold
Bull Void: Low - high > (ATR200 × multiplier)
Bear Void: Low - high > (ATR200 × multiplier)
Validation: Close confirms gap direction
Storage: Global array maintains last 30 voids
Key Design Features
Real-time Updates: Calculated every bar, not just on last bar
Global Persistence: Arrays maintain state across executions
FIFO Management: Automatic cleanup of oldest entries
Configurable Sensitivity: Adjustable lookback periods and thresholds
Scientific Testing Framework
Hypothesis Testing
Primary Hypothesis: 3D terrain visualization improves detection of institutional order flow vs traditional 2D charts
Testable Metrics:
Prediction Accuracy: Does terrain structure predict future support/resistance?
Reaction Time: Faster identification of key levels vs conventional methods
False Positive Reduction: Lower rate of failed breakouts/breakdowns
Control Variables
Market Regime: Trending vs ranging conditions
Asset Classes: Forex, equities, cryptocurrencies
Timeframes: M5 to H4 for intraday, D1 for swing
Volume Conditions: High vs low volume environments
Data Collection Protocol
Terrain Features to Quantify:
Slope gradient changes at price inflection points
Volume peak clustering density
Order block terrain elevation vs subsequent price action
Void depth correlation with momentum acceleration
Control Group: Traditional support/resistance + volume profile
Experimental Group: 3D Institutional Flow Terrain
Statistical Measures
Signal-to-Noise Ratio: Terrain features vs random price movements
Lead Time: Terrain formation ahead of price confirmation
Effect Size: Performance difference between groups (Cohen's d)
Statistical Power: Sample size requirements for significance
Validation Methodology
Blind Testing:
Remove price labels from terrain screenshots
Have traders identify key levels from terrain alone
Measure accuracy vs actual price action
Backtesting Framework:
Automated terrain feature extraction
Correlation with future price reversals/breakouts
Monte Carlo simulation for significance testing
Expected Outcomes
If hypothesis valid:
Significant improvement in level prediction accuracy (p < 0.05)
Reduced latency in institutional level identification
Higher risk-reward ratios on terrain-confirmed trades
Research Questions:
Does terrain elevation reliably indicate institutional interest zones?
Are liquidity voids statistically significant momentum predictors?
Does multi-timeframe terrain analysis improve signal quality?
How does terrain persistence correlate with level strength?
LuxAlgo BigBeluga hapharmonic

Highs and Lows MarkerIndicator Description – Highs and Lows Marker
This indicator identifies swing highs and swing lows based on a simple two-candle pattern structure:
High Formation (Swing High):
A High is marked when a bullish candle (Candle Up) is immediately followed by a bearish candle (Candle Down).
The High value is taken as the highest wick price between the two candles in this formation.
This represents a potential short-term resistance or turning point in the market.
Low Formation (Swing Low):
A Low is marked when a bearish candle (Candle Down) is immediately followed by a bullish candle (Candle Up).
The Low value is taken as the lowest wick price between the two candles in this formation.
This represents a potential short-term support or reversal area.
Liquidity Swap Detector Ultimate - Cedric JeanjeanAdvanced Smart Money Concepts indicator designed to detect high-probability liquidity sweeps and institutional order flow reversals. This professional-grade tool combines multiple ICT (Inner Circle Trader) strategies to identify optimal entry points.
═══════════════════════════════════════════════════════
📊 KEY FEATURES:
✅ Smart Swing Detection
- Identifies confirmed swing highs and lows using adaptive lookback periods
- Eliminates false signals through double-confirmation logic
- Detects liquidity grabs at key market structure points
✅ Fair Value Gap (FVG) Analysis
- Multi-timeframe FVG detection for enhanced accuracy
- Filters imbalances by minimum size threshold
- Combines current timeframe and higher timeframe FVGs
✅ Advanced Volatility Filter
- ATR-based volatility analysis to avoid low-quality setups
- Adjustable volatility threshold (default 0.35%)
- Ensures entries during optimal market conditions
✅ Precision Signal Generation
- LONG signals: Confirmed swing lows + FVG + volatility confirmation
- SHORT signals: Confirmed swing highs + FVG + volatility confirmation
- Clear visual markers with price labels
✅ Comprehensive Alert System
- Three alert types: Simple, Detailed, JSON (for webhooks)
- Separate LONG/SHORT alert controls
- Compatible with MT5 integration via webhooks
- TradingView native alertcondition support
✅ Professional Dashboard
- Real-time ATR monitoring
- Volatility percentage display
- FVG status indicator
- Alert status tracker
═══════════════════════════════════════════════════════
⚙️ CUSTOMIZABLE PARAMETERS:
🔹 Lookback Swing (1-50): Defines swing detection sensitivity
🔹 ATR Multiplier: Controls wick filter strength
🔹 Volatility Filter: Minimum required market volatility (%)
🔹 FVG Filter: Minimum fair value gap size (%)
🔹 FVG Timeframe: Higher timeframe for multi-TF analysis
🔹 Visual Options: Toggle swing marks, FVG zones, labels
🔹 Alert Controls: Enable/disable LONG/SHORT notifications
═══════════════════════════════════════════════════════
📈 HOW IT WORKS:
1. The indicator scans for confirmed swing points using a robust double-confirmation algorithm
2. Simultaneously analyzes Fair Value Gaps on both current and higher timeframes
3. Validates market volatility to ensure sufficient price movement
4. Generates precise entry signals when all conditions align
5. Triggers customizable alerts for instant notification
═══════════════════════════════════════════════════════
🎯 BEST PRACTICES:
- Use on liquid markets (Forex majors, indices, crypto)
- Recommended timeframes: 15m, 1H, 4H
- Combine with support/resistance for confirmation
- Adjust lookback period based on market volatility
- Test alert settings before live trading
- Use JSON alerts for automated trading integration
═══════════════════════════════════════════════════════
⚡ ALERT CONFIGURATION:
1. Click the Alert icon (bell) in TradingView
2. Select "Liquidity Swap Detector Ultimate - TITAN v6"
3. Choose your preferred alert condition:
- LONG Signal: Only bullish setups
- SHORT Signal: Only bearish setups
- ANY Signal: All trading opportunities
4. Set expiration and notification preferences
5. For MT5 integration: Select "JSON" message type and configure webhook URL

Bitgak [Osprey]🟠 INTRODUCTION
Bitgak , translated as "Oblique Angle" in Korean, is a strategy used by multi-hundred-million traders in Korea, sometimes more heavily than Fibonacci retracement.
It is a concept that by connecting two or more pivot points on the chart and creating equidistant parallel lines, we can spot other pivot points. As seen in the example, a line at a different height but with the same angle spots many pivot points.
This indicator spots pivot points on the chart and tests all different possible Bitgak lines with a brute-force method. Then it shows the parallel line configuration with the most pivots hitting it. You may use the lines drawn on the chart as possible reversal points.
It is best to use on Day and Week candles . In the very short range of time, the noise makes it hard to capture meaningful data.
🟠 HOW TO USE
The orange dots are the major pivot points (you can set the period of the long-term pivot) upon which the lines are built.
Change the "Manual Lookback Bars" from 300 to a meaningful period upon your inspection.
"Hit Tolerance %" means how close a pivot needs to be to the line to be considered as having touched the line.
If the line is too narrow, which is not very useful, you may consider increasing the "Long-term Pivot Bars" and experimenting with different settings for Channel Lines and Heuristics.
The result:
"Top Anchors to Test (L)" is how many L highest peaks and L lowest troughs should be weighed heavily when testing the lines. That is, with L = 1, the algorithm will reward the Bitgak lines that touch 1 highest peak and 1 lowest trough. It doesn't make much intuitive sense, so I suggest just testing it out.
🟠 HOW IT WORKS
Step 1: Pivot Detection
The indicator runs two parallel detection systems:
Short-term pivots (default: 7 bars on each side) - Captures minor swing highs/lows for detailed analysis
Long-term pivots (default: 17 bars on each side) - Identifies major structural turning points
These pivots form the foundation for all channel calculations.
Step 2: Anchor Point Selection
From the detected long-term pivots, the algorithm identifies:
The L highest peaks (default L=1, meaning the single highest peak)
The L lowest troughs (default L=1, meaning the single lowest trough)
These become potential "anchor points" for channel construction. Higher L values test more combinations but increase computation time.
Step 3: Channel Candidate Generation
For support channels: Every pair of troughs becomes a potential base line (A-B)
For resistance channels: Every pair of peaks becomes a potential base line (A-B)
The algorithm then tests each peak (for support) or trough (for resistance) as pivot C.
Step 4: Optimal Spacing Calculation
For each A-B-C combination, the algorithm calculates:
Unit Spacing = (Distance from C to A-B line) / Multiplier
It tests multipliers from 0.5 to 4.0 (or your custom range), asking: "If pivot C sits on the 1.0 line, what spacing makes the most pivots hit other lines?"
Step 5: Scoring & Selection
Each configuration is scored by counting how many pivots fall within tolerance (default 1% of price) of any parallel line in the range . The highest-scoring channel is drawn on your chart.

Volume Profile, Pivot Anchored by DGT - reviewedVolume Profile, Pivot Anchored by DGT - reviewed
This indicator, “Volume Profile, Pivot Anchored”, builds a volume profile between swing highs and lows (pivot points) to show where trading activity is concentrated.
It highlights:
Value Area (VAH / VAL) and Point of Control (POC)
Volume distribution by price level
Pivot-based labels showing price, % change, and volume
Optional colored candles based on volume strength relative to the average
Essentially, it visualizes how volume is distributed between market pivots to reveal key price zones and volume imbalances.

Swing Points & Liquidity — ENHANCED PRO (Dark/Light Mode)This indicator — “Swing Points & Liquidity — ENHANCED PRO (Dark/Light Mode)” — automatically detects and visualizes swing highs, swing lows, and liquidity levels on the chart with rich analytics and customizable visuals.
🔍 Core Features
Smart Swing Detection: Identifies pivot highs/lows based on adjustable left/right bar settings.
Liquidity Visualization: Draws dynamic boxes and lines for liquidity pools and swing zones.
Volume & OI Integration: Filters and colors levels using volume and Open Interest Δ (change).
Strength Meter: Highlights strong liquidity levels with color gradients based on OI + volume intensity.
Automatic Trendlines: Connects swing points with selectable style and width.
Fibonacci Mapping: Automatically projects fib retracements (23.6%, 38.2%, 50%, 61.8%, 78.6%) from swing-to-swing for confluence zones.
Statistics Panel: Displays live metrics — total levels, active/filled count, success rate, and average strength.
Alerts System: Alerts for new swing formations and when price touches or breaks a level.
Multi-Timeframe Option: Analyze swing structures from higher timeframes on any chart.
Dual Theme Mode: Fully optimized for both Dark and Light interface preferences.
⚙️ Advanced Options
Adjustable lookback range
Hide or extend filled levels
Configurable volume and OI thresholds
Supports multiple OI data sources (Binance, BitMEX, Kraken)
Fully dynamic text, color, and label alignment settings
💡 Use Case
Perfect for Smart Money Concept (SMC) and ICT-style analysis, liquidity sweeps, and swing-based trading.
Traders can quickly visualize where liquidity sits, track how it gets filled, and monitor structure shifts in real time.

TwistedHWAY Oracle - Intelligent Level Detection System═════════════════════════════════════════════════════════════════════════
🎯 TwistedHWAY Oracle™ - Intelligent Level Detection System
═════════════════════════════════════════════════════════════════════════
OVERVIEW
TwistedHWAY Oracle™ combines six independent calculation engines to identify high-probability support and resistance levels. The indicator uses adaptive market regime detection and confluence analysis to automatically rank levels by confidence score, helping traders identify key reaction zones where price is likely to find support or resistance.
KEY FEATURES
The indicator provides comprehensive level detection through:
Six Detection Engines — Each engine operates independently with its own alert system
Confluence Analysis — Automatically awards bonus confidence when multiple engines identify the same level
Adaptive Intelligence — Market volatility detection adjusts parameters in real-time
Confidence Scoring — Every level is ranked and displayed with a numerical confidence score
Individual Alerts — Separate alert controls for each detection method
DETECTION ENGINES
1 — Pivot Points Engine
Calculates daily pivot levels including PP, R1-R3, and S1-S3 using previous day's high, low, and close.
2 — Swing Detector
Identifies significant swing highs and lows using prominence filtering to eliminate noise.
3 — Psychological Matrix
Detects round number levels at three configurable increments (default: 10, 25, 50).
4 — Fibonacci Engine
Calculates retracement levels (23.6%, 38.2%, 50%, 61.8%, 78.6%) from major swings.
5 — VWAP System
Generates volume-weighted average price levels at three different periods.
6 — Confluence Analyzer
Awards bonus confidence points when multiple engines identify the same level.
HOW TO USE
Reading the Levels
Levels above current price = Resistance (red by default)
Levels below current price = Support (green by default)
Numbers in brackets show confidence score
Higher confidence = stronger level
Levels with score > 2.0 indicate extreme confluences
Trading Strategies
Bounce Trading — Enter positions when price approaches high-confidence levels expecting reversal
Breakout Trading — Trade breakouts through levels, using broken level as stop-loss
Confluence Zones — Focus on areas where multiple engines agree
SETTINGS GUIDE
Oracle Settings
Validation Mode — Conservative parameters for more reliable signals
Max Levels — Number of levels to display (10-50)
Level Extension — Line extension direction (None/Left/Right/Both)
Individual Engine Controls
Each engine can be toggled on/off with separate alert controls:
Pivot Engine (daily pivots)
Swing Detector (historical swings)
Psychological Matrix (round numbers)
Fibonacci Engine (retracements)
VWAP System (volume-weighted levels)
Visual Settings
Individual color selection for each level type
Label display toggle with size options
Line style preferences (Solid/Dashed/Dotted)
Alert Configuration
Alert Distance % — Proximity threshold (default: 0.5%)
Alert Cooldown — Minimum bars between alerts (default: 60)
Individual alert toggles for each engine
ADAPTIVE PARAMETERS
The indicator automatically adjusts to market conditions:
High Volatility Mode — Wider swing detection, stricter prominence filters
Normal Mode — Balanced parameters for typical market conditions
Validation Mode — Most conservative settings for reliable signals
Market regime is detected using 100-period volatility measurement with automatic threshold adjustment.
ALERTS
Five alert types plus special confluence alerts:
🎯 Pivot Alerts — Daily pivot level approaches
🌊 Swing Alerts — Historical swing level tests
🧠 Psychological Alerts — Round number approaches
🌀 Fibonacci Alerts — Retracement level tests
📉 VWAP Alerts — Volume-weighted level approaches
⚡ Critical Alerts — Ultra-high confidence levels (score ≥ 2.0)
Alerts include price level, confidence score, and source information.
BEST PRACTICES
Timeframe Selection
Works on all timeframes (optimized for 5min to Daily)
Higher timeframes = more reliable levels
Use multi-timeframe analysis for confirmation
Optimization by Instrument
Forex:
Psychological increments: 0.0010, 0.0050, 0.0100
Stocks (Low-priced):
Psychological increments: 1, 5, 10
Stocks (High-priced):
Psychological increments: 10, 25, 50
Crypto:
Adjust based on price range and volatility
LIMITATIONS
Calculation intensive on last bar (may cause slight delays)
Maximum 50 levels can be displayed simultaneously
Swing detection requires minimum 25 bars of history
VWAP calculations use price range as volume proxy when volume unavailable
NOTES
Levels are recalculated on each bar close
Confidence scores update dynamically with market conditions
Colors automatically adjust based on price position
All settings are saved with chart layout
═════════════════════════════════════════════════════════════════════════
Version: 3.0 | Build 2025.10
License: GNU GPL v3.0
© 2025 TwistedHWAY
═════════════════════════════════════════════════════════════════════════
Market Structure ICT Screener [TradingFinder] BoS ChoCh🔵 Introduction
Market Structure is the foundation of every Smart Money and ICT based trading model. It describes how price moves through a sequence of highs and lows, forming clear phases of expansion, retracement and reversal. Understanding this structure allows traders to read institutional order flow and align their positions with the true direction of liquidity.
Two of the most critical components in Market Structure are the Break of Structure (BOS) and Change of Character (CHOCH). A BOS represents trend continuation, confirming strength within the current direction. In contrast, CHOCH also known as a Market Structure Shift (MSS) signals the first sign of a trend reversal or liquidity shift where order flow begins to change from bullish to bearish or vice versa.
Because the market is fractal, structure can exist at multiple levels known as Major (External) and Minor (Internal). Major structure defines the overall trend on higher timeframes while minor or internal structure reveals short term swings and early reversals within that larger move.
🔵 How to Use
Understanding Market Structure starts with identifying how price interacts with previous swing highs and swing lows. Every trend in the market, whether bullish or bearish, is built from a sequence of impulsive and corrective moves. Impulsive legs show strong displacement in the direction of liquidity flow, while corrective legs represent temporary pullbacks as the market rebalances before the next expansion. Recognizing these sequences is essential for reading the story of price and anticipating what may happen next.
A Break of Structure (BOS) occurs when price decisively moves beyond a previous structural point by breaking above the last high in an uptrend or falling below the last low in a downtrend. This event confirms that the current trend remains intact and that liquidity has been successfully taken from one side of the market. A BOS acts as confirmation of continuation and reflects strength within the existing directional bias.
A Change of Character (CHOCH) appears when price violates structure in the opposite direction of the prevailing trend. This is the first signal that market sentiment and order flow may be shifting. For example, during a downtrend if price breaks above a previous high, it indicates that sellers are losing control and a potential bullish reversal may be developing. In an uptrend, when price drops below a recent low, it suggests a possible bearish transition.
Because the market is fractal, structure exists across multiple layers. Major structure reflects the dominant movement visible on higher timeframes and defines the broader directional bias. Minor or internal structure represents smaller swings within that move and helps identify early transitions before they appear on the higher timeframe. When internal and external structures align, they offer a high probability signal for trend continuation or reversal.
By observing BOS and CHOCH across both internal and external structures, traders can clearly visualize when the market is expanding, contracting or preparing to shift direction. This structured understanding of price movement forms the foundation for precise trend analysis and high quality decision making in any Smart Money or ICT based trading approach.
🔵 Settings
🟣 Display Settings
Table on Chart : Allows users to choose the position of the signal dashboard either directly on the chart or below it, depending on their layout preference.
Number of Symbols : Enables users to control how many symbols are displayed in the screener table, from 10 to 20, adjustable in increments of 2 symbols for flexible screening depth.
Table Mode : This setting offers two layout styles for the signal table :
Basic : Mode displays symbols in a single column, using more vertical space.
Extended : Mode arranges symbols in pairs side-by-side, optimizing screen space with a more compact view.
Table Size : Lets you adjust the table’s visual size with options such as: auto, tiny, small, normal, large, huge.
Table Position : Sets the screen location of the table. Choose from 9 possible positions, combining vertical (top, middle, bottom) and horizontal (left, center, right) alignments.
🟣 Symbol Settings
Each of the 20 symbol slots comes with a full set of customizable parameters :
Symbol : Define or select the asset (e.g., XAUUSD, BTCUSD, EURUSD, etc.).
Timeframe : Set your desired timeframe for each symbol (e.g., 15, 60, 240, 1D).
Pivot Period : Set the length used to detect swing highs and lows. Shorter values increase sensitivity, longer ones focus on major structures.
🔵 Conclusion
Mastering Market Structure and understanding the relationship between BOS and CHOCH allows traders to see the market with greater clarity and confidence. These two elements reveal how liquidity moves through different phases of expansion and retracement and how institutional order flow shifts between accumulation and distribution.
By analyzing both internal and external structures, traders can align short term and long term perspectives and anticipate where price is most likely to react. The ability to read these structural shifts helps identify continuation points, reversals and areas where liquidity is engineered or collected.
Incorporating Market Structure into a consistent trading process transforms the way a trader views the chart. Instead of reacting to random movements, each swing, break and shift becomes part of a logical framework that reflects the true behavior of the market. Understanding BOS and CHOCH is not just a concept but a complete language of price that guides every professional decision in Smart Money and ICT based trading.

Market Structure (BOS on Break, HH/HL/LH/LL)Market Structure (BOS on Break, HH/HL/LH/LL) is a clean and reactive market structure tool designed for traders who want clear visual feedback of trend direction and structure changes.
It automatically identifies:
Higher Highs (HH)
Higher Lows (HL)
Lower Highs (LH)
Lower Lows (LL)
Breaks of Structure (BOS) when price breaches previous swing levels.
✳️ Features
Automatic Structure Detection: Detects swing highs/lows based on your left/right pivot settings.
Break of Structure Alerts: Instantly updates bias when price breaks a previous swing level (no delay).
Real-Time BOS Response: Structure flips as soon as price takes out the previous high or low.
Color-Coded Bars: Bars can auto-paint white for bullish and black for bearish conditions.
Optional Fading Dots: Visual fading dots track trend duration and strength for quick bias reading.
Customizable Pivots: Choose how many bars to use for left/right swing confirmation.
Alerts: Fully configured for HH, HL, LH, LL, BOS Up, and BOS Down events.
⚙️ Inputs
Left Pivot Bars / Right Pivot Bars: Control how many candles define a valid swing point.
Paint Bars by Trend: Toggle bar coloring to match bullish or bearish bias.
Show Fading Trend Dots: Add fading dots that shrink and fade as a trend matures.
🔔 Alerts
Break of Structure Up / Down
Higher High (HH) confirmed
Higher Low (HL) confirmed
Lower High (LH) confirmed
Lower Low (LL) confirmed
🎯 Use Case
Perfect for:
Price action traders
Smart money concept (SMC) practitioners
Trend structure analysts
Scalpers and swing traders looking for quick structure flips.
🧠 Notes
Works on any timeframe and any instrument.
BOS signals update immediately when price breaks structure (no lag).
For additional BOS markers, you can uncomment the last few lines in the script to show arrows when structure breaks.

Advanced Market Structure [OmegaTools]📌 Market Structure
Advanced Market Structure is a next–generation indicator designed to decode price structure in real time by combining classical swing–based analysis with modern quantitative confirmation techniques. Built for traders who demand both precision and adaptability, it provides a robust multi–layered framework to identify structural shifts, trend continuations, and potential reversals across any asset class or timeframe.
Unlike traditional structure indicators that rely solely on visual swing identification, Market Structure introduces an integrated methodology: pivot detection, Donchian trend modeling, statistical confirmation via Z–Score, and volume–based validation. Each element contributes to a comprehensive, systematic representation of the underlying market dynamics.
🔑 Core Features
1. Five Distinct Market Structure Modes
Standard Mode:
Captures structural breaks through classical swing high/low pivots. Ideal for discretionary traders looking for clarity in directional bias.
Confirmed Breakout Mode:
Requires validation beyond the initial pivot break, filtering out noise and reducing false positives.
Donchian Trend HL (High/Low):
Establishes structure based on absolute highs and lows over rolling lookback windows. This approach highlights broader momentum shifts and trend–defining extremes.
Donchian Trend CC (Close/Close):
Similar to HL mode, but calculated using closing prices, enabling more precise bias identification where close–to–close structure carries stronger statistical weight.
Average Mode:
A composite methodology that synthesizes the four models into a weighted signal, producing a balanced structural bias designed to minimize model–specific weaknesses.
2. Dynamic Pivot Recognition with Auto–Updating Levels
Swing highs and lows are automatically detected and plotted with adaptive horizontal levels. These dynamic support/resistance markers continuously extend into the future, ensuring that historically significant levels remain visible and actionable.
3. Color–Adaptive Candlesticks
Price bars are dynamically recolored to reflect the prevailing structural regime: bullish (default blue), bearish (default red), or neutral (gray). This enables instant visual recognition of regime changes without requiring external confirmation.
4. Statistical Reversal Triggers
The script integrates a 21–period Z–Score calculation applied to closing prices, combined with multi–layered volume confirmation (SMA and EMA convergence).
Bullish trigger: Z–Score < –2 with structural confirmation and volume support.
Bearish trigger: Z–Score > +2 with structural confirmation and volume support.
Signals are plotted as diamond markers above or below the bars, identifying potential high–probability reversal setups in real time.
5. Integrated Alpha Backtesting Engine
Each market structure mode is evaluated through a built–in backtesting routine, tracking hit ratios and consistency across the most recent ~2000 structural events.
Performance metrics (“Alpha”) are displayed directly on–chart via a dedicated Performance Dashboard Table, allowing side–by–side comparison of Standard, Confirmed Breakout, Donchian HL, Donchian CC, and Average models.
Traders can instantly evaluate which structural methodology best adapts to the current market conditions.
🎯 Practical Advantages
Systematic Clarity: Eliminates subjectivity in defining structural bias, offering a rules–based framework.
Statistical Transparency: Built–in performance metrics validate each mode in real time, allowing informed decision–making.
Noise Reduction: Confirmed Breakouts and Donchian modes filter out common traps in structural trading.
Multi–Asset Adaptability: Optimized for scalping, intraday, swing, and multi–day strategies across FX, equities, futures, commodities, and crypto.
Complementary Usage: Works as a stand–alone structure identifier or as a quantitative filter in larger algorithmic/trading frameworks.
⚙️ Ideal Users
Discretionary traders seeking an objective reference for structural bias.
Quantitative/systematic traders requiring on–chart statistical validation of structural regimes.
Technical analysts leveraging pivots, Donchian channels, and price action as part of broader frameworks.
Portfolio traders integrating structure into multi–factor models.
💡 Why This Tool?
Market Structure is not a static indicator — it is an adaptive framework. By merging classical pivot theory with Donchian–style momentum analysis, and reinforcing both with statistical backtesting and volume confirmation, it provides traders with a unique ability:
To see the structure,
To measure its reliability,
And to act with confidence on quantifiably validated signals.

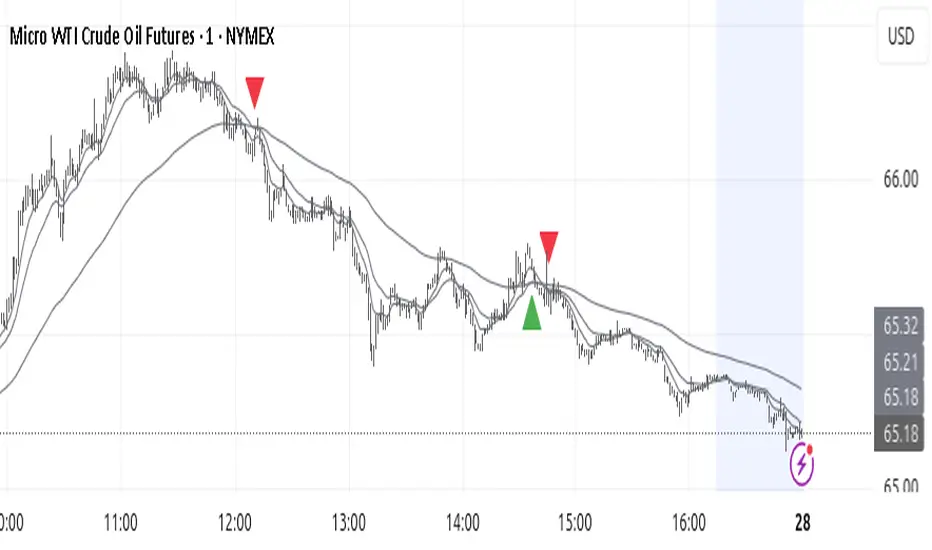
Trend TraderThe Trend Trader indicator is a trend-following tool based on a triple EMA (Exponential Moving Average) setup designed to help traders identify market direction and potential reversal zones. It plots three customizable EMAs on the chart to highlight bullish and bearish momentum, then generates trade signals when price shows a strong likelihood of continuing in the direction of the prevailing trend.
EMA Alignment: The indicator checks for bullish stacking (fast EMA above medium, medium above slow) and bearish stacking (fast EMA below medium, medium below slow). This alignment defines the prevailing market trend.
Trend Validation: A user-defined lookback period ensures signals are only taken if the market recently displayed a stacked trend, thus filtering false entries during consolidations.
Signal Generation: Buy signals appear when price dips into the zone between the fast and medium EMAs during a bullish trend. Sell signals appear when price rallies into the zone between the fast and medium EMAs during a bearish trend.
Alerts: Built-in alerts notify traders of new trade opportunities without having to constantly watch the chart.
This indicator is suitable for swing trading and intraday strategies across multiple markets, including forex, stocks, indices, and crypto.
Suggested Strategy for Profitability
This tool is best used as part of a structured trend-trading plan. Below is a suggested framework:
Entry Rules
Long (Buy Trade):
Confirm that EMA alignment is bullish (EMA1 > EMA2 > EMA3).
Wait for a Buy Signal (triangle up below price).
Ensure the higher timeframe (e.g., 4H if trading 1H) trend is also bullish to filter trades.
Short (Sell Trade):
Confirm EMA alignment is bearish (EMA1 < EMA2 < EMA3).
Wait for a Sell Signal (triangle down above price).
Higher timeframe should also be bearish to increase probability.
Stop Loss
For long positions, place the stop loss just below EMA3 or the most recent swing low.
For short positions, place the stop loss just above EMA3 or the most recent swing high.
Take Profit
Conservative: Set TP at 1.5x to 2x the stop loss distance.
Aggressive: Trail stop loss below EMA2 (for longs) or above EMA2 (for shorts) to capture larger trends.
Risk Management
Use no more than 1–2% of account risk per trade.
Trade only when the signal aligns with overall market context (higher timeframe, support/resistance, or volume confirmation).
This indicator is very similar to the indicator "Trend Scalper" by the same developer, the difference is this indicator is used to just find the trade and hold the trade or to find the reversal of a trend instead of triggering alerts every time price enters between EMA1 and EMA2.
Simple Auto Swing Lines# Simple Auto Swing Lines
## What It Does
This indicator automatically draws horizontal support and resistance lines based on swing highs and lows with line management and touch-based alerts.
## How It Works
**Swing Detection:**
- Uses pivot point analysis to identify significant highs and lows
- Configurable pivot strength determines sensitivity (higher = more significant swings)
- Draws horizontal lines from these swing points extending to current price
**Line Management:**
- Proximity Filter: Removes lines that are too close together to prevent clutter
- Auto-Hide Feature: Lines disappear after price closes beyond them for a set number of candles
- Permanent Clipping: Once a line is crossed for the threshold period, it stays hidden
- Dynamic Updates: Only shows the most relevant recent swing levels
**Touch-Based Alert System:**
- "Swing High touched" - Alerts when price touches resistance lines from any direction
- "Swing Low touched" - Alerts when price touches support lines from any direction
- "Any Swing Level touched" - Combined alert for any swing line interaction
## Key Settings
**Pivot Detection:**
- Pivot Strength (50): Higher values = fewer, more significant swing lines
- Max Lookback Bars (1000): How far back to look for swing points
**Line Appearance:**
- Max Lines (5): Maximum number of swing lines per side (total lines = 2x this number)
- Line Thickness (1-5): Customize line width
- Resistance/Support Colors: Red for highs, green for lows
- Show Labels: Optional swing high/low labels (default: off)
**Display Controls:**
- Proximity Filter (2000 ticks): Minimum distance between lines to prevent clutter
- Candles Before Hide (7): How many consecutive closes beyond a line before permanent removal
Dynamic Swing Anchored VWAP STRAT (Zeiierman/PineIndicators)Dynamic Swing Anchored VWAP STRATEGY — Zeiierman × PineIndicators (Pine Script v6)
A pivot-to-pivot Anchored VWAP strategy that adapts to volatility, enters long on bullish structure, and closes on bearish structure. Built for TradingView in Pine Script v6.
Full credits to zeiierman.
Repainting notice: The original indicator logic is repainting. Swing labels (HH/HL/LH/LL) are finalized after enough bars have printed, so labels do not occur in real time. It is not possible to execute at historical label points. Treat results as educational and validate with Bar Replay and paper trading before considering any discretionary use.
Concept
The script identifies swing highs/lows over a user-defined lookback ( Swing Period ). When structure flips (most recent swing low is newer than the most recent swing high, or vice versa), a new regime begins.
At each confirmed pivot, a fresh Anchored VWAP segment is started and updated bar-by-bar using an EWMA-style decay on price×volume and volume.
Responsiveness is controlled by Adaptive Price Tracking (APT) . Optionally, APT auto-adjusts with an ATR ratio so that high volatility accelerates responsiveness and low volatility smooths it.
Longs are opened/held in bullish regimes and closed when the regime turns bearish. No short positions are taken by design.
How it works (under the hood)
Swing detection: Uses ta.highestbars / ta.lowestbars over prd to update swing highs (ph) and lows (pl), plus their bar indices (phL, plL).
Regime logic: If phL > plL → bullish regime; else → bearish regime. A change in this condition triggers a re-anchor of the VWAP at the newest pivot.
Adaptive VWAP math: APT is converted to an exponential decay factor ( alphaFromAPT ), then applied to running sums of price×volume and volume, producing the current VWAP estimate.
Rendering: Each pivot-anchored VWAP segment is drawn as a polyline and color-coded by regime. Optional structure labels (HH/HL/LH/LL) annotate the swing character.
Orders: On bullish flips, strategy.entry("L") opens/maintains a long; on bearish flips, strategy.close("L") exits.
Inputs & controls
Swing Period (prd) — Higher values identify larger, slower swings; lower values catch more frequent pivots but add noise.
Adaptive Price Tracking (APT) — Governs the VWAP’s “half-life.” Smaller APT → faster/closer to price; larger APT → smoother/stabler.
Adapt APT by ATR ratio — When enabled, APT scales with volatility so the VWAP speeds up in turbulent markets and slows down in quiet markets.
Volatility Bias — Tunes the strength of APT’s response to volatility (above 1 = stronger effect; below 1 = milder).
Style settings — Colors for swing labels and VWAP segments, plus line width for visibility.
Trade logic summary
Entry: Long when the swing structure turns bullish (latest swing low is more recent than the last swing high).
Exit: Close the long when structure turns bearish.
Position size: qty = strategy.equity / close × 5 (dynamic sizing; scales with account equity and instrument price). Consider reducing the multiplier for a more conservative profile.
Recommended workflow
Apply to instruments with reliable volume (equities, futures, crypto; FX tick volume can work but varies by broker).
Start on your preferred timeframe. Intraday often benefits from smaller APT (more reactive); higher timeframes may prefer larger APT (smoother).
Begin with defaults ( prd=50, APT=20 ); then toggle “Adapt by ATR” and vary Volatility Bias to observe how segments tighten/loosen.
Use Bar Replay to watch how pivots confirm and how the strategy re-anchors VWAP at those confirmations.
Layer your own risk rules (stops/targets, max position cap, session filters) before any discretionary use.
Practical tips
Context filter: Consider combining with a higher-timeframe bias (e.g., daily trend) and using this strategy as an entry timing layer.
First pivot preference: Some traders prefer only the first bullish pivot after a bearish regime (and vice versa) to reduce whipsaw in choppy ranges.
Deviations: You can add VWAP deviation bands to pre-plan partial exits or re-entries on mean-reversion pulls.
Sessions: Session-based filters (RTH vs. ETH) can materially change behavior on futures and equities.
Extending the script (ideas)
Add stops/targets (e.g., ATR stop below last swing low; partial profits at k×VWAP deviation).
Introduce mirrored short logic for two-sided testing.
Include alert conditions for regime flips or for price-VWAP interactions.
Incorporate HTF confirmation (e.g., only long when daily VWAP slope ≥ 0).
Throttle entries (e.g., once per regime flip) to avoid over-trading in ranges.
Known limitations
Repainting: Swing labels and pivot confirmations depend on future bars; historical labels can look “perfect.” Treat them as annotations, not executable signals.
Execution realism: Strategy includes commission and slippage fields, yet actual fills differ by venue/liquidity.
No guarantees: Past behavior does not imply future results. This publication is for research/education only and not financial advice.
Defaults (backtest environment)
Initial capital: 10,000
Commission value: 0.01
Slippage: 1
Overlay: true
Max bars back: 5000; Max labels/polylines set for deep swing histories
Quick checklist
Add to chart and verify that the instrument has volume.
Use defaults, then tune APT and Volatility Bias with/without ATR adaptation.
Observe how each pivot re-anchors VWAP and how regime flips drive entries/exits.
Paper trade across several symbols/timeframes before any discretionary decisions.
Attribution & license
Original indicator concept and logic: Zeiierman — please credit the author.
Strategy wrapper and publication: PineIndicators .
License: CC BY-NC-SA 4.0 (Attribution-NonCommercial-ShareAlike). Respect the license when forking or publishing derivatives.
